Defining impact for Toyota Finance's sustainability roadmap
ROLE / DATA PROCESSOR & INFOGRAPHIC DESIGNER
THE CHALLENGE
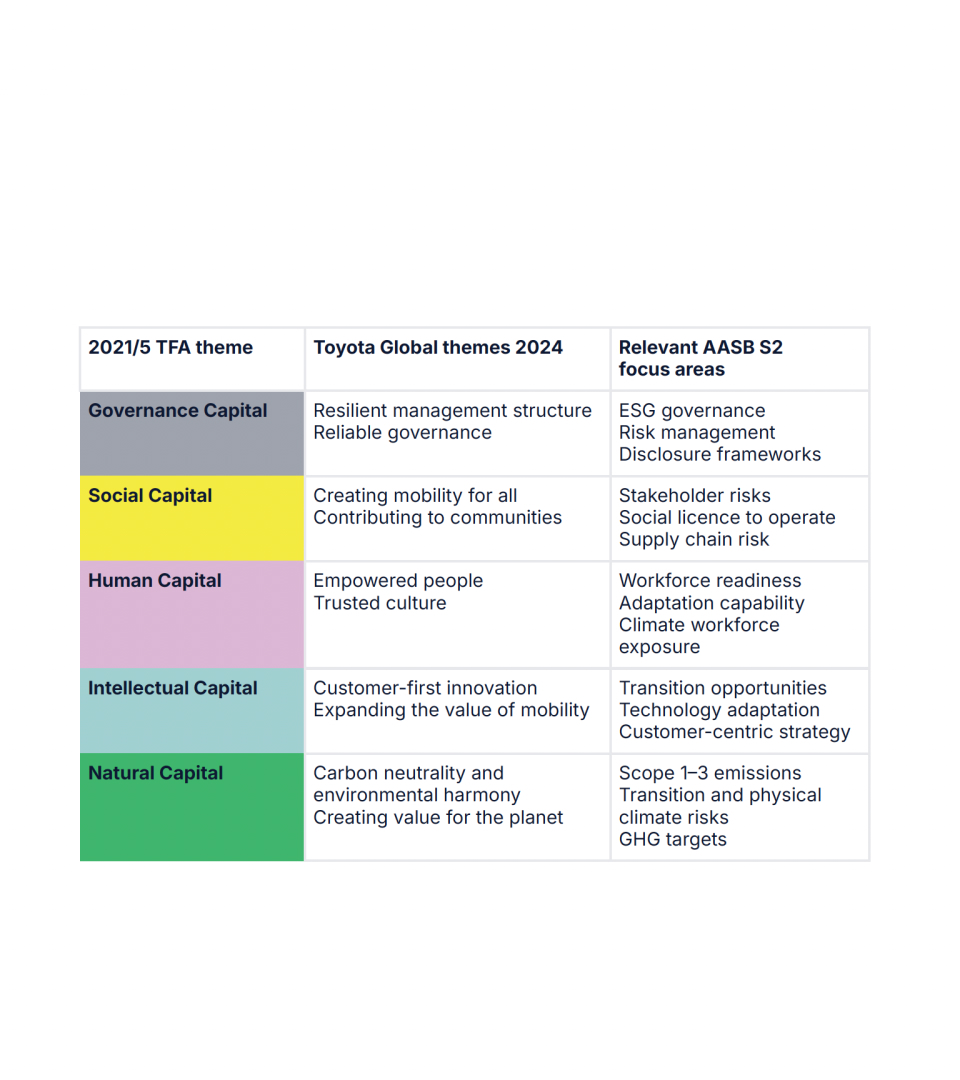
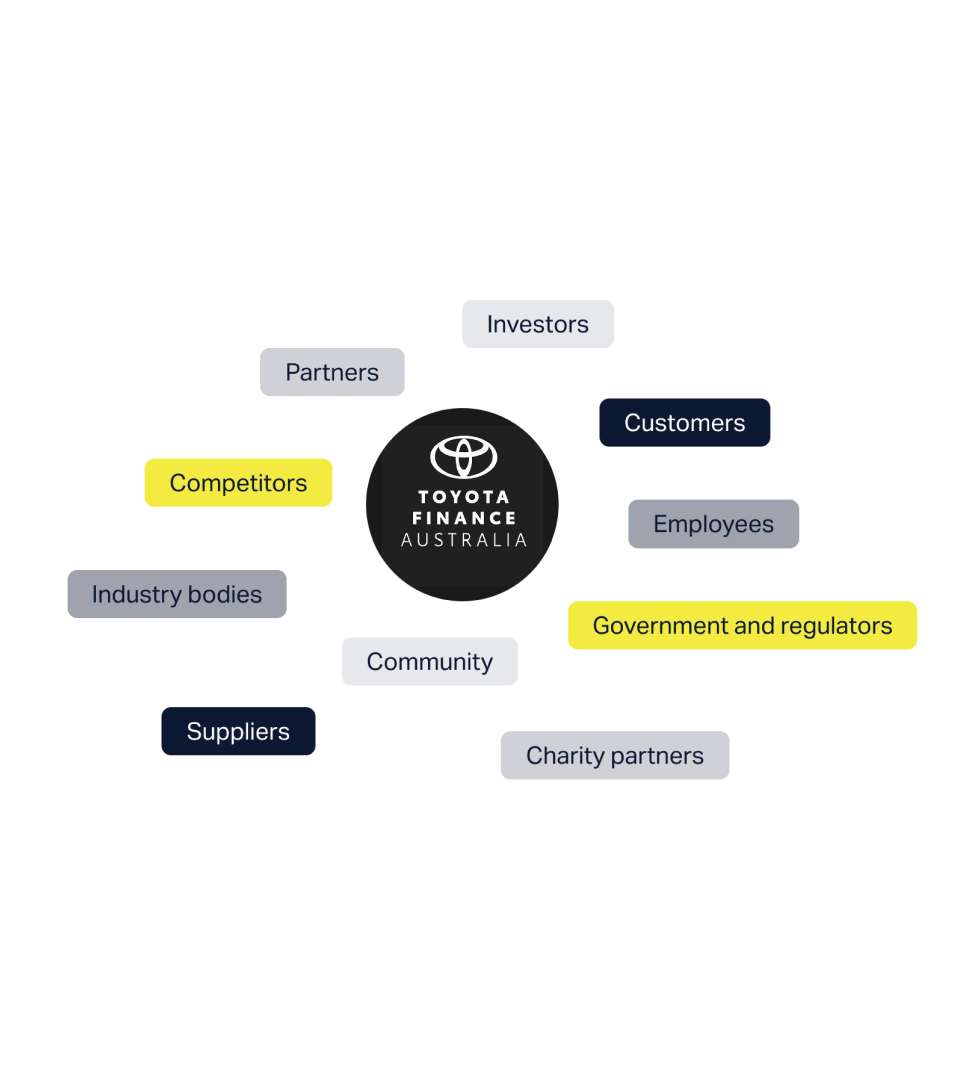
Toyota Finance wanted clarity on its sustainability impact. The business had lots of data but no simple way to see what truly mattered in the sustainability space. They needed clear metrics that could shape future strategy and tell a story everyone could understand. The goal was to turn complex datasets into insights that could guide decisions across the business.
THE PROCESS
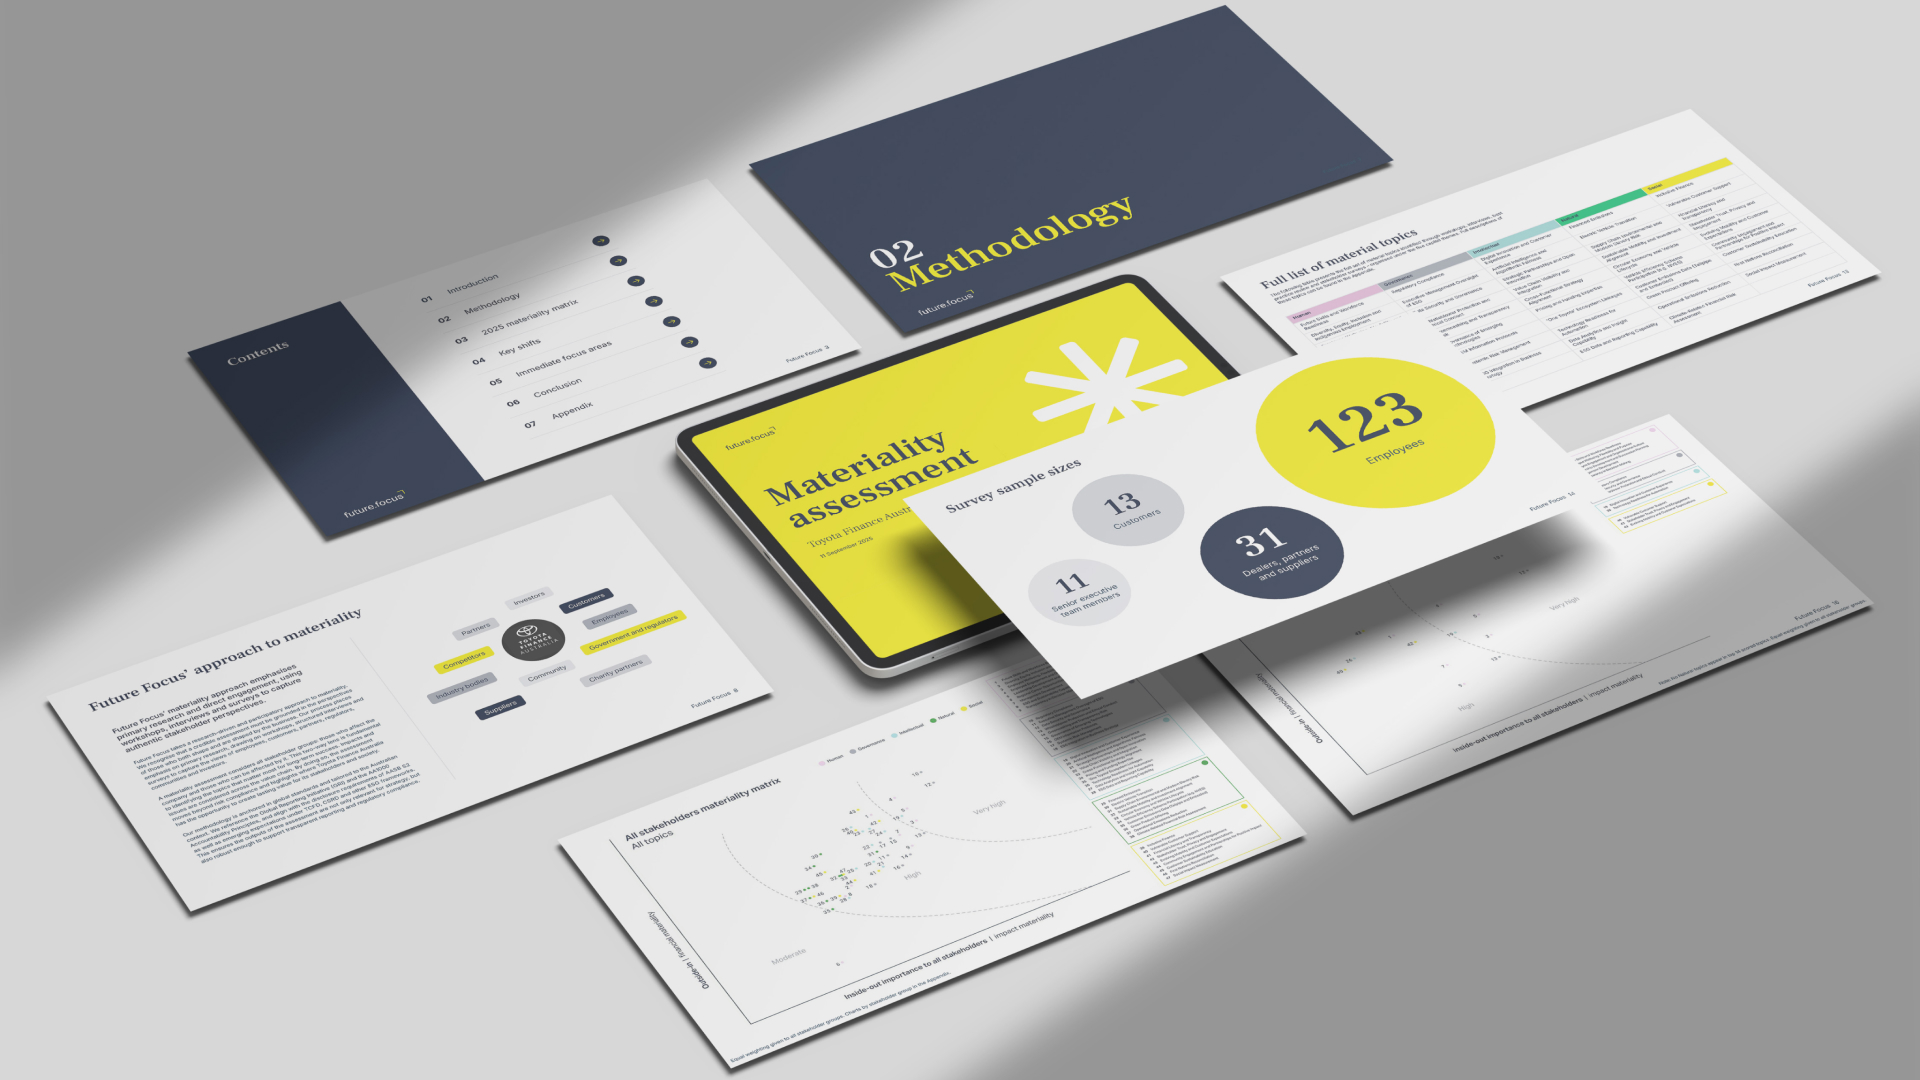
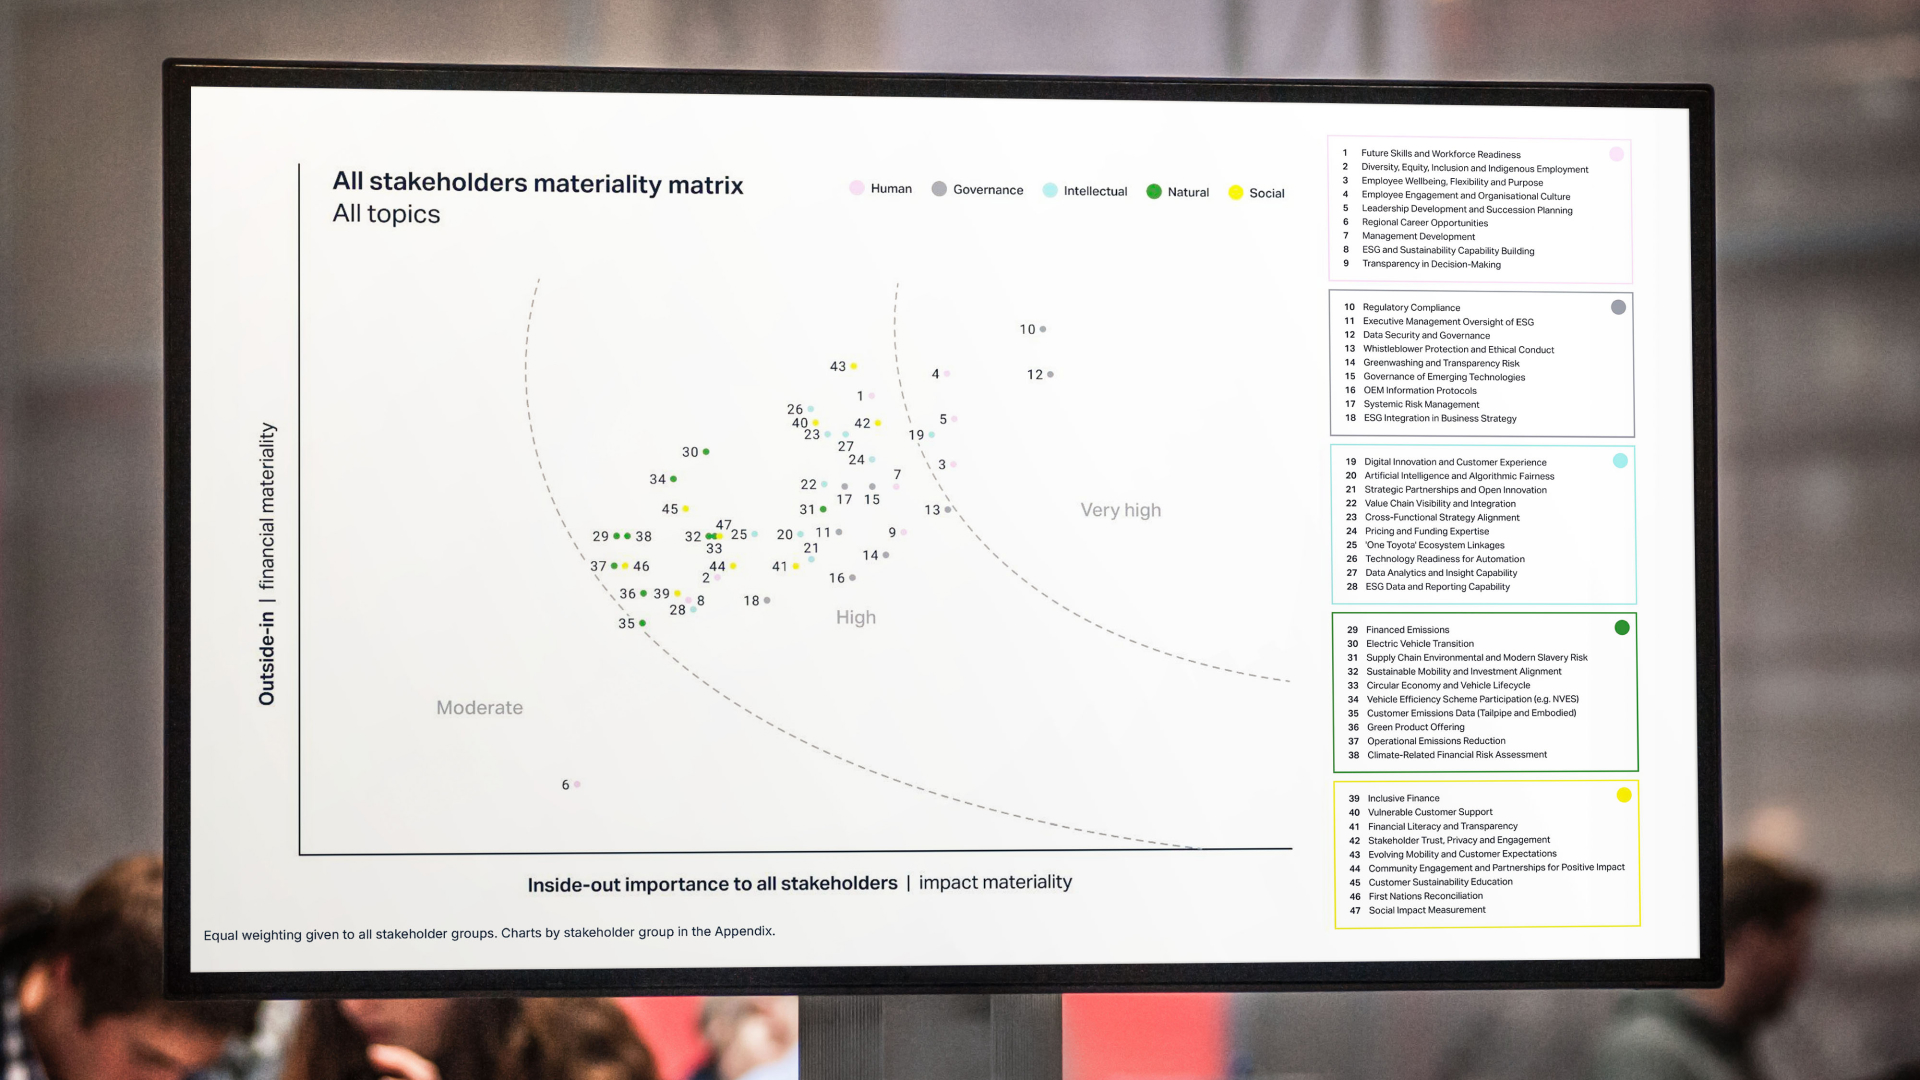
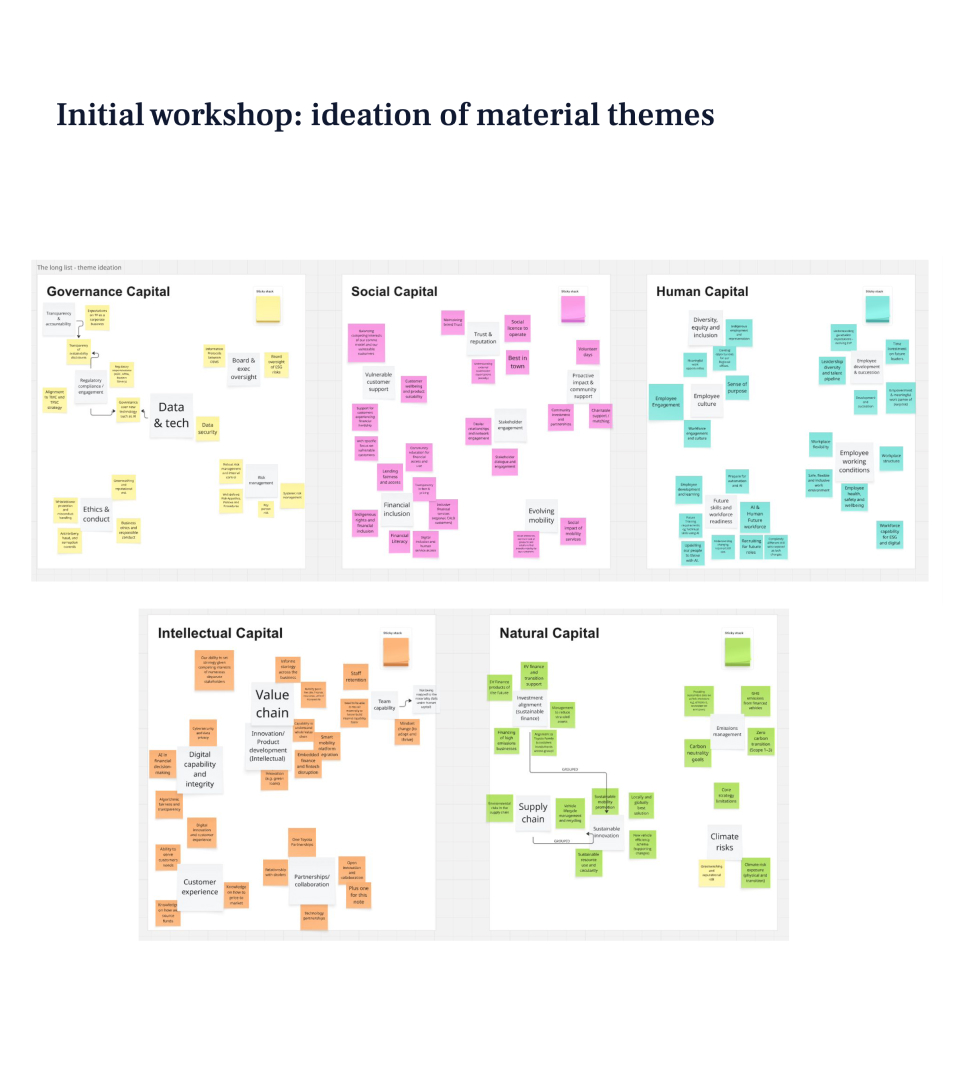
First, I listened. I spent time understanding what Toyota Finance needed and why it mattered. I gathered data sources from teams across the business and gained clarity on their sustainability priorities. Next, I processed the metrics. I worked with the data that was inputted into Google Sheets, cleaned and organised it, and looked for patterns that showed real impact. Then I translated the findings into a research summary. I drafted engaging infographics that made complicated information easy to understand and digest. I tested layouts, iterated designs and refined messaging based on feedback from the team.
THE SYSTEM
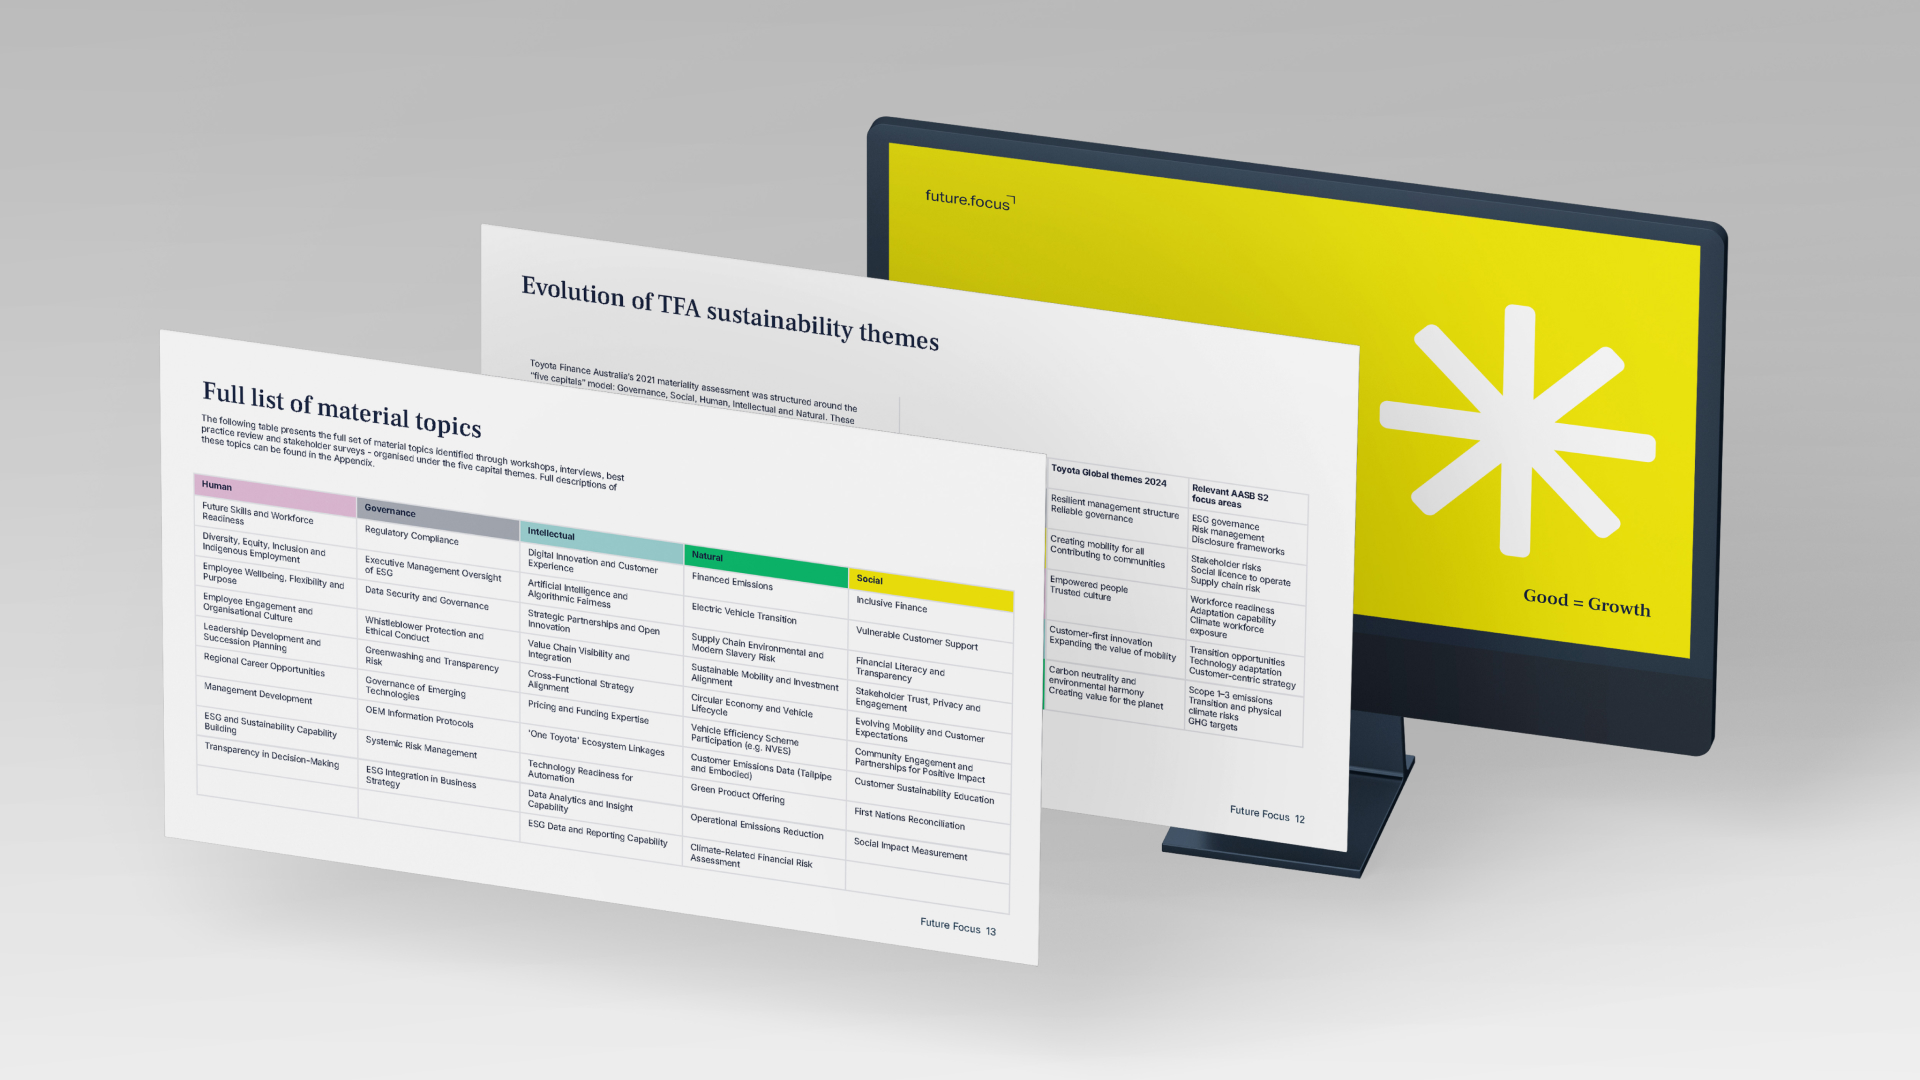
To keep the work modular and scalable, I built a simple but structured system that could be updated over time. I designed infographic templates in Figma that can be reused with new data. I created clear data tables and formulas in Google Sheets so key metrics can be recalculated easily. I laid out the final research summary in Google Slides so it can be shared, presented and updated across teams.
THE IMPACT
The project gave Toyota Finance a clear set of impact metrics they can use as the foundation of their sustainability strategy.
Teams now have visuals that make complex data easy to understand. Leaders can use the summaries to make decisions. Everyone can see where the business is performing well and where opportunities for improvement exist. The infographics and templates also provide a shared language across the business for talking about sustainability.
TECH & CORE SKILLS
– Infographic design
– Data processing
– Figma, Google Sheets & Slides
– Data strategy
– Team collaboration
Selected works
Fellowmind's evolution as a digital partnerDigital Experience, Branding & Campaign
Wavin's innovative sustainability product breakthroughDigital Platform
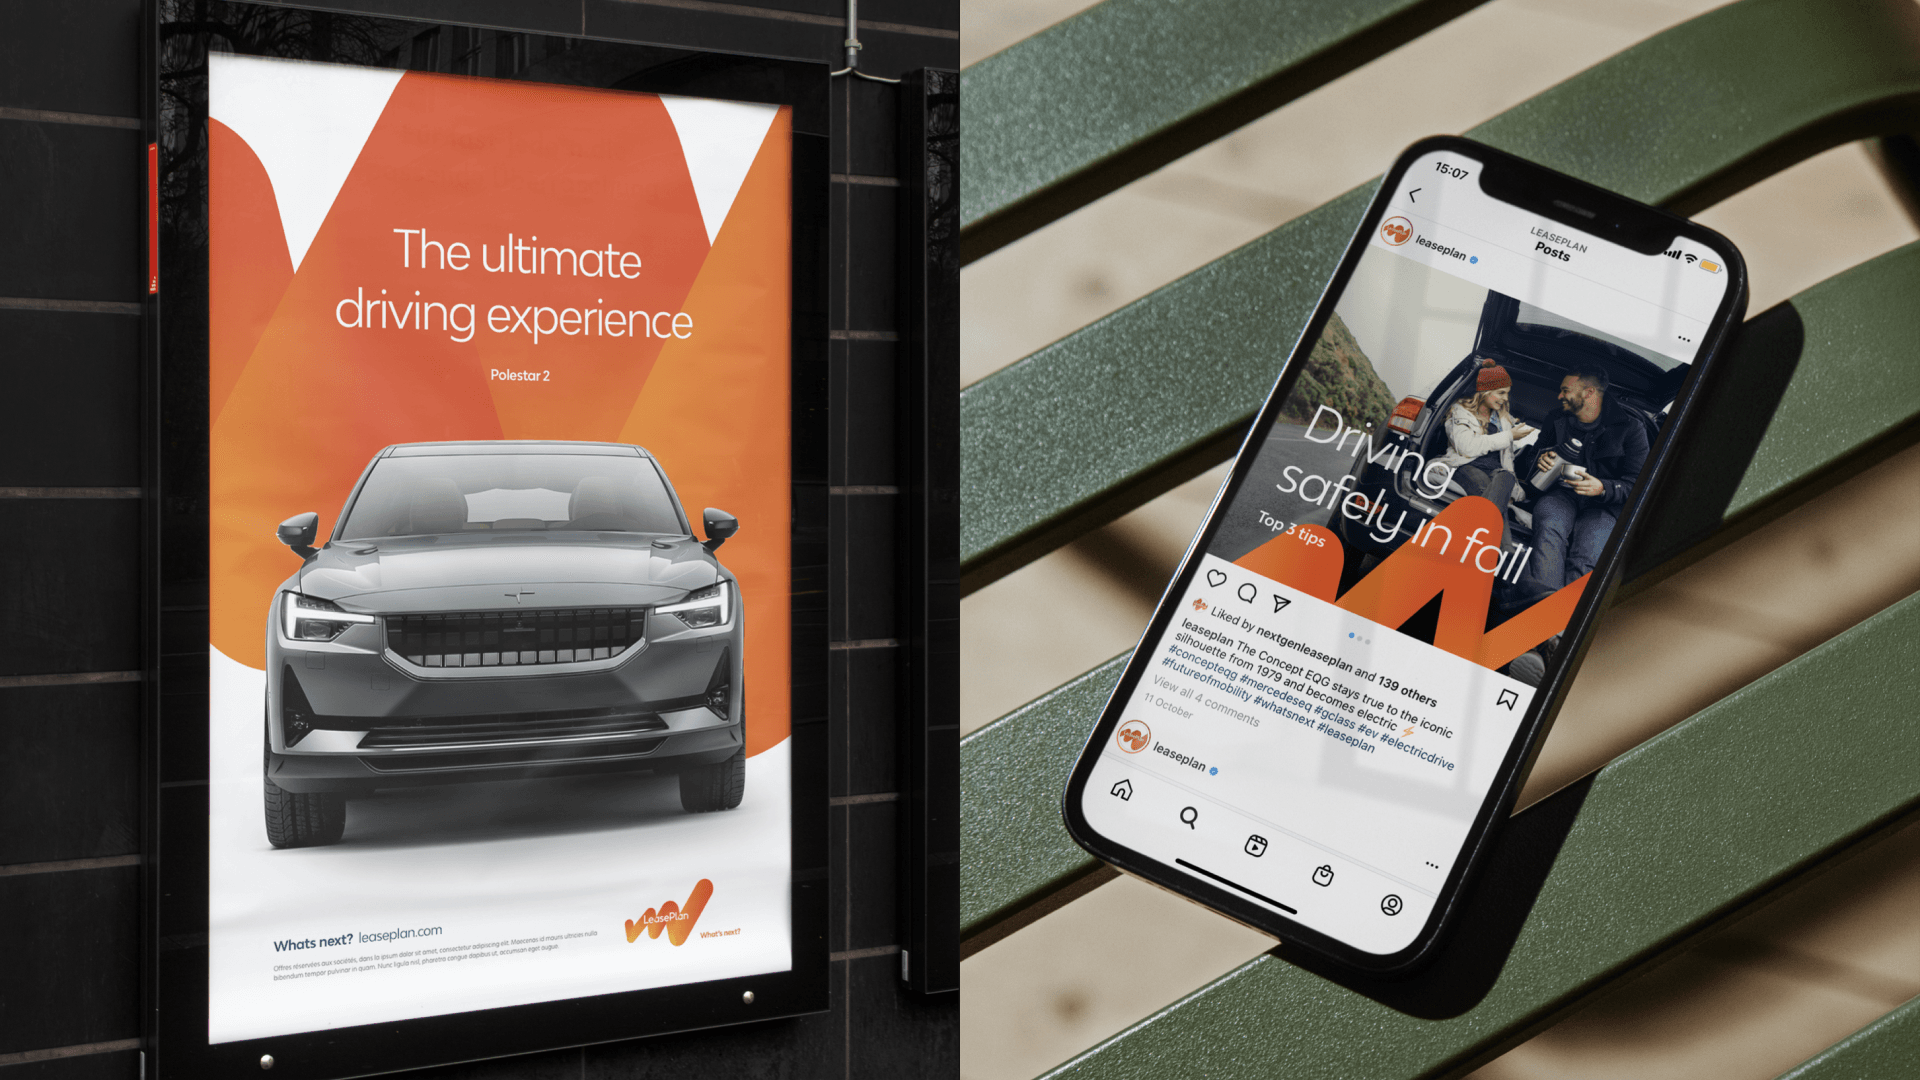
LeasePlan's transition to what's next in sustainable mobilityBrand Realignment
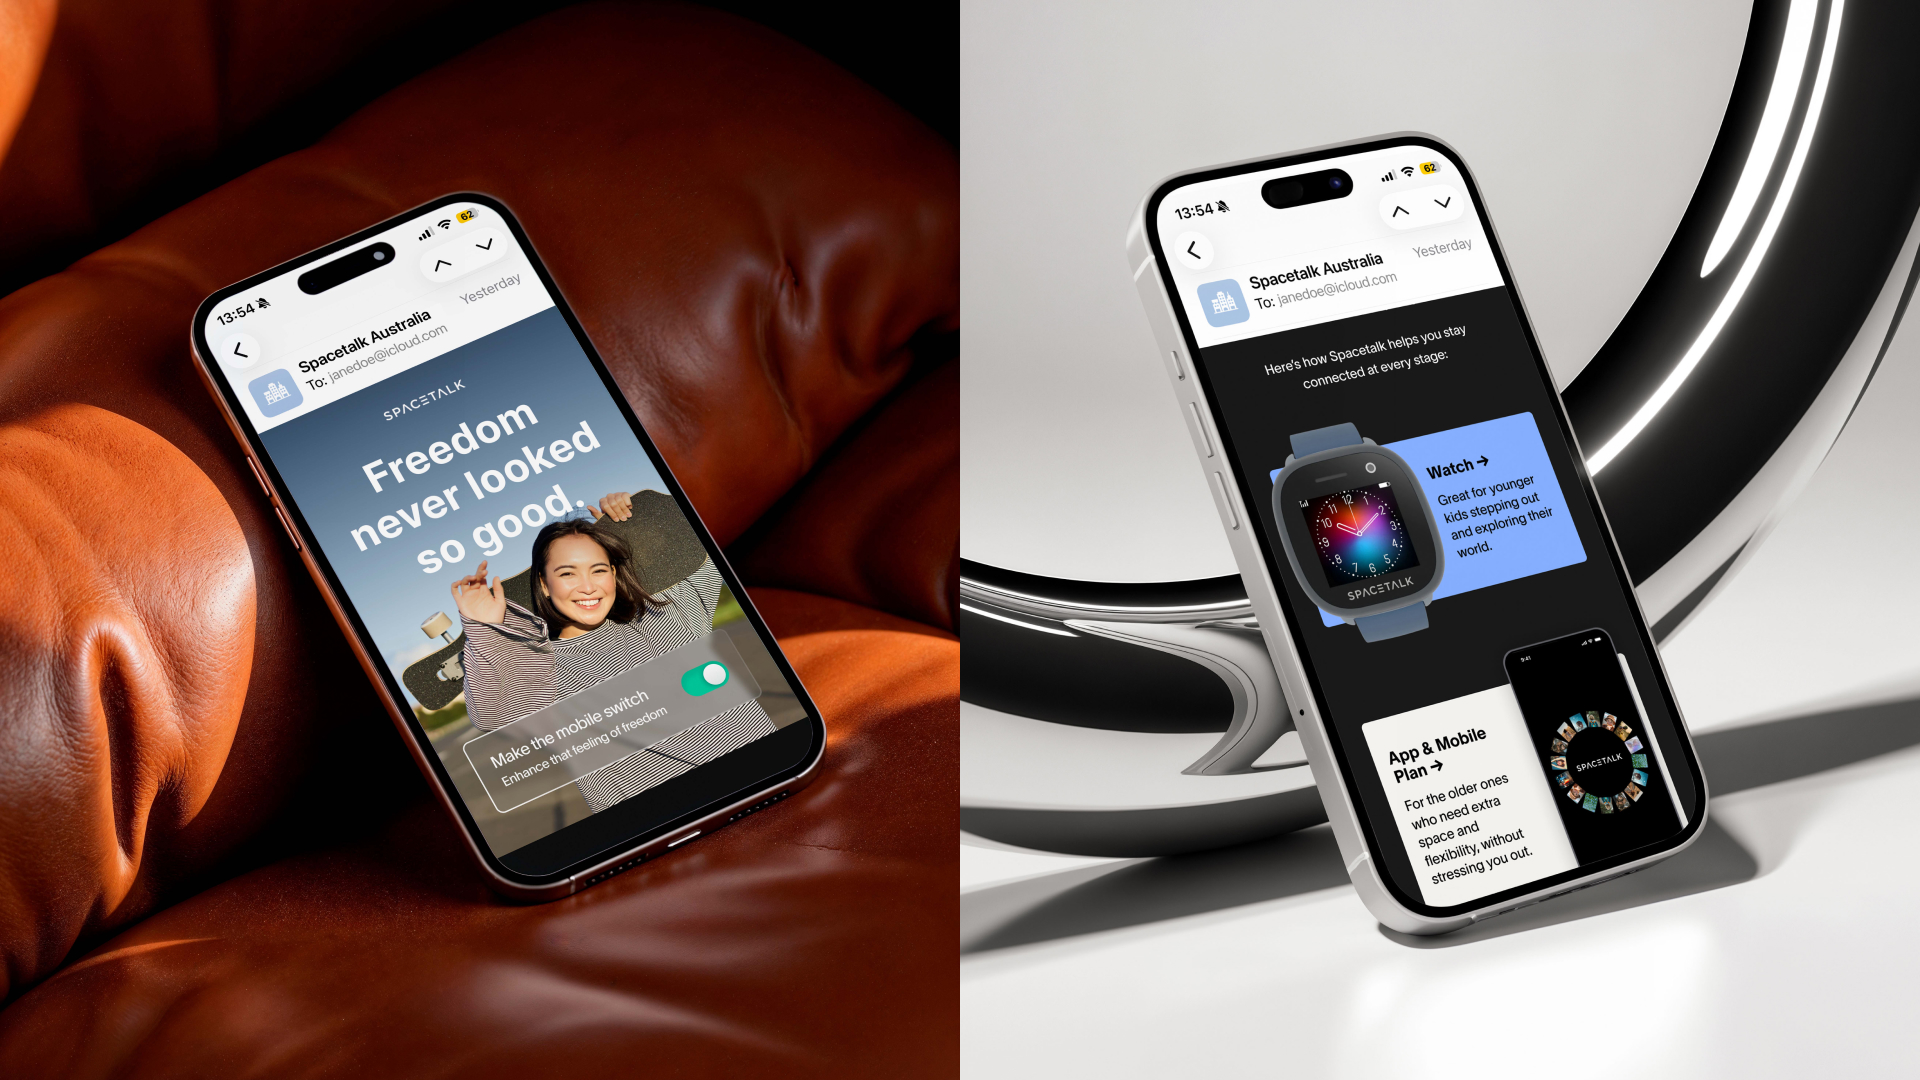
Elevating Spacetalk's vision of connected familiesDigital Campaign & Content
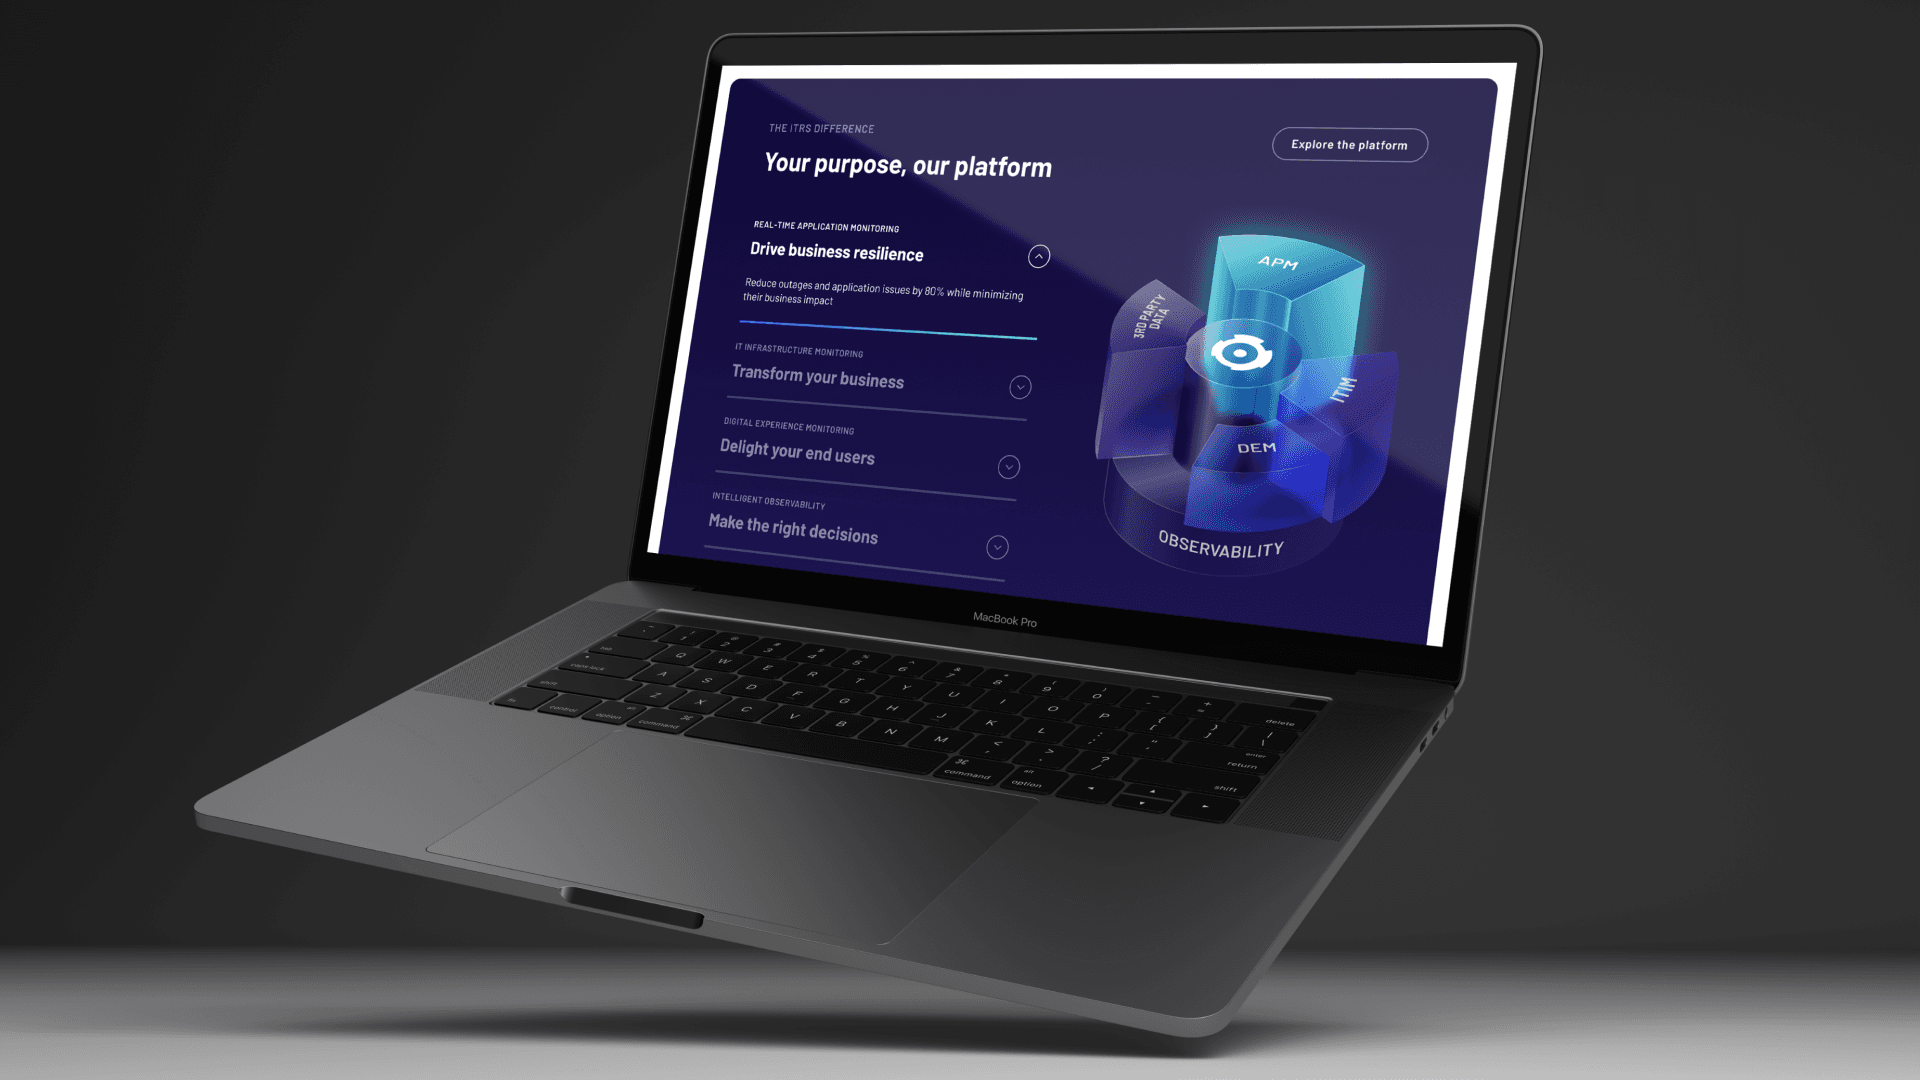
ITRS as a leader in AI-powered real-time monitoring solutionsDigital Experience & Branding
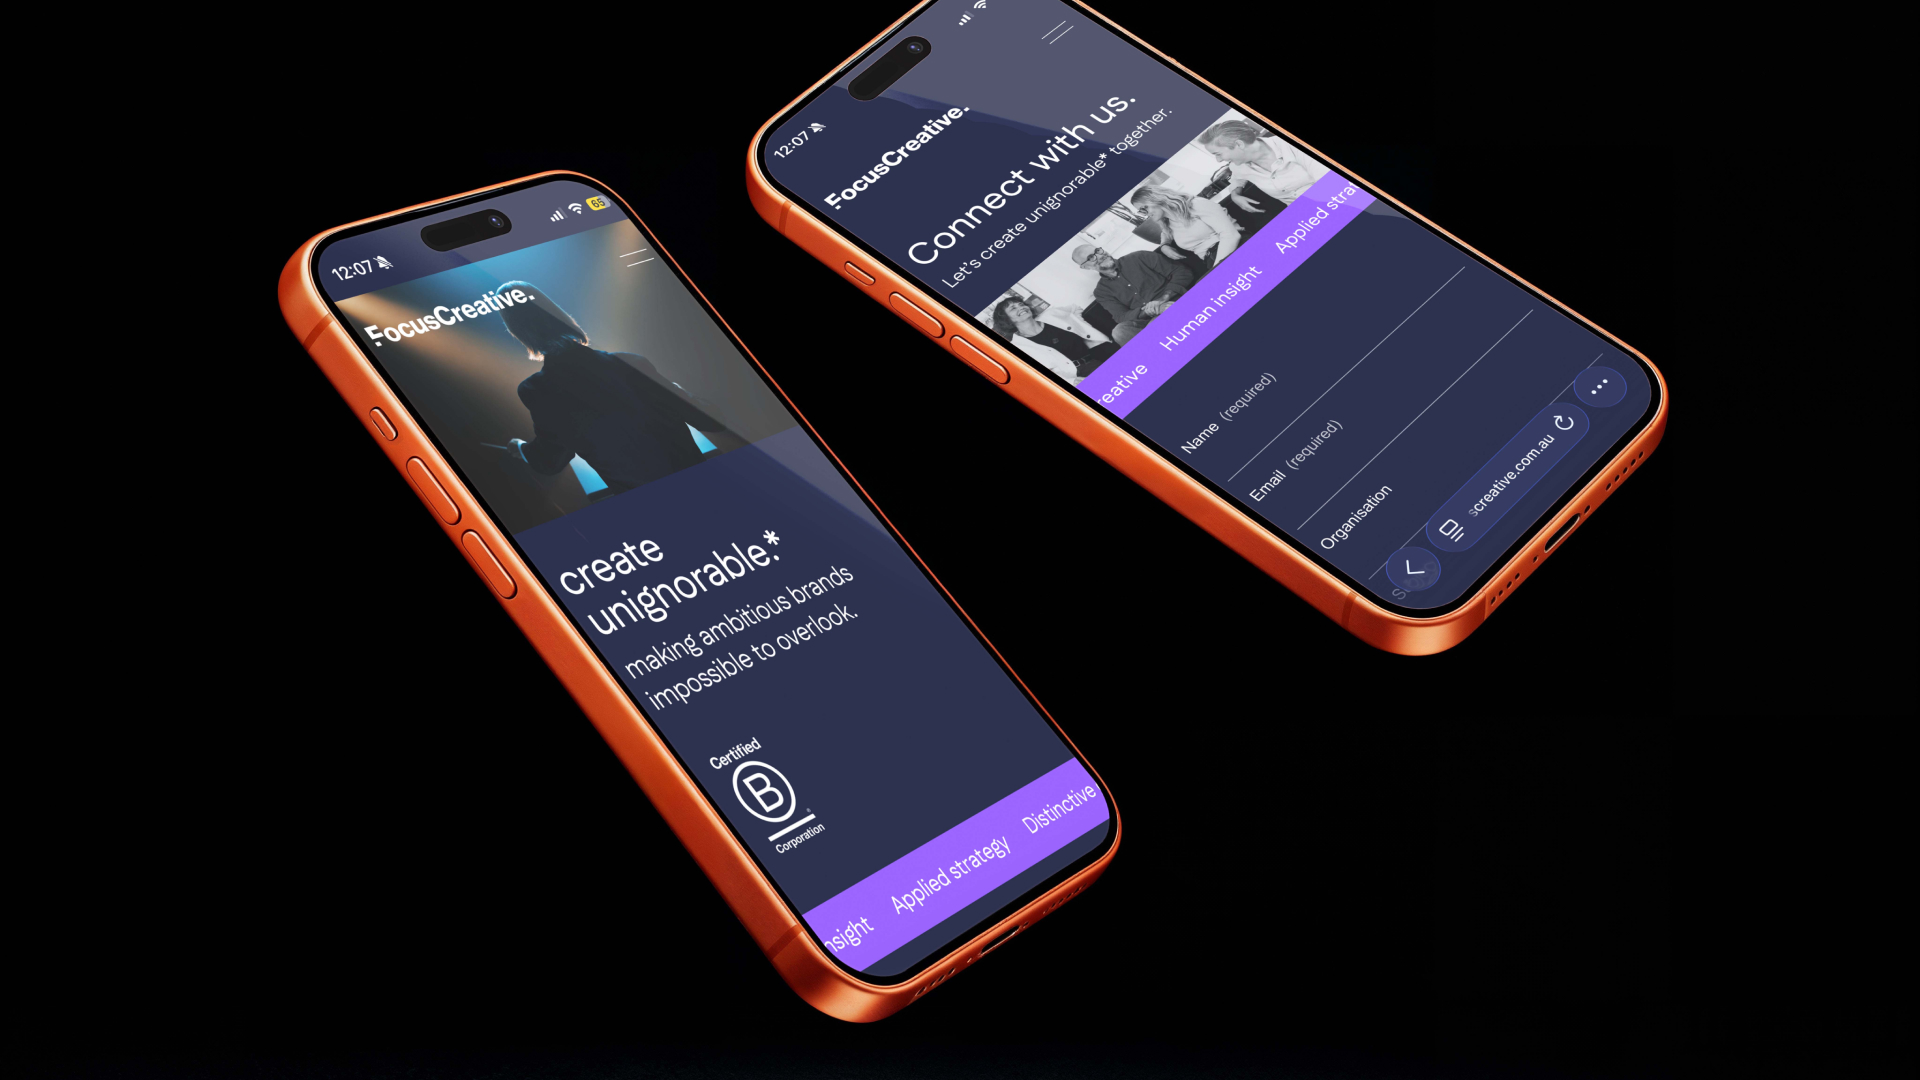
Sharpening Focus Creative's edge in a crowded marketDigital Experience & Branding
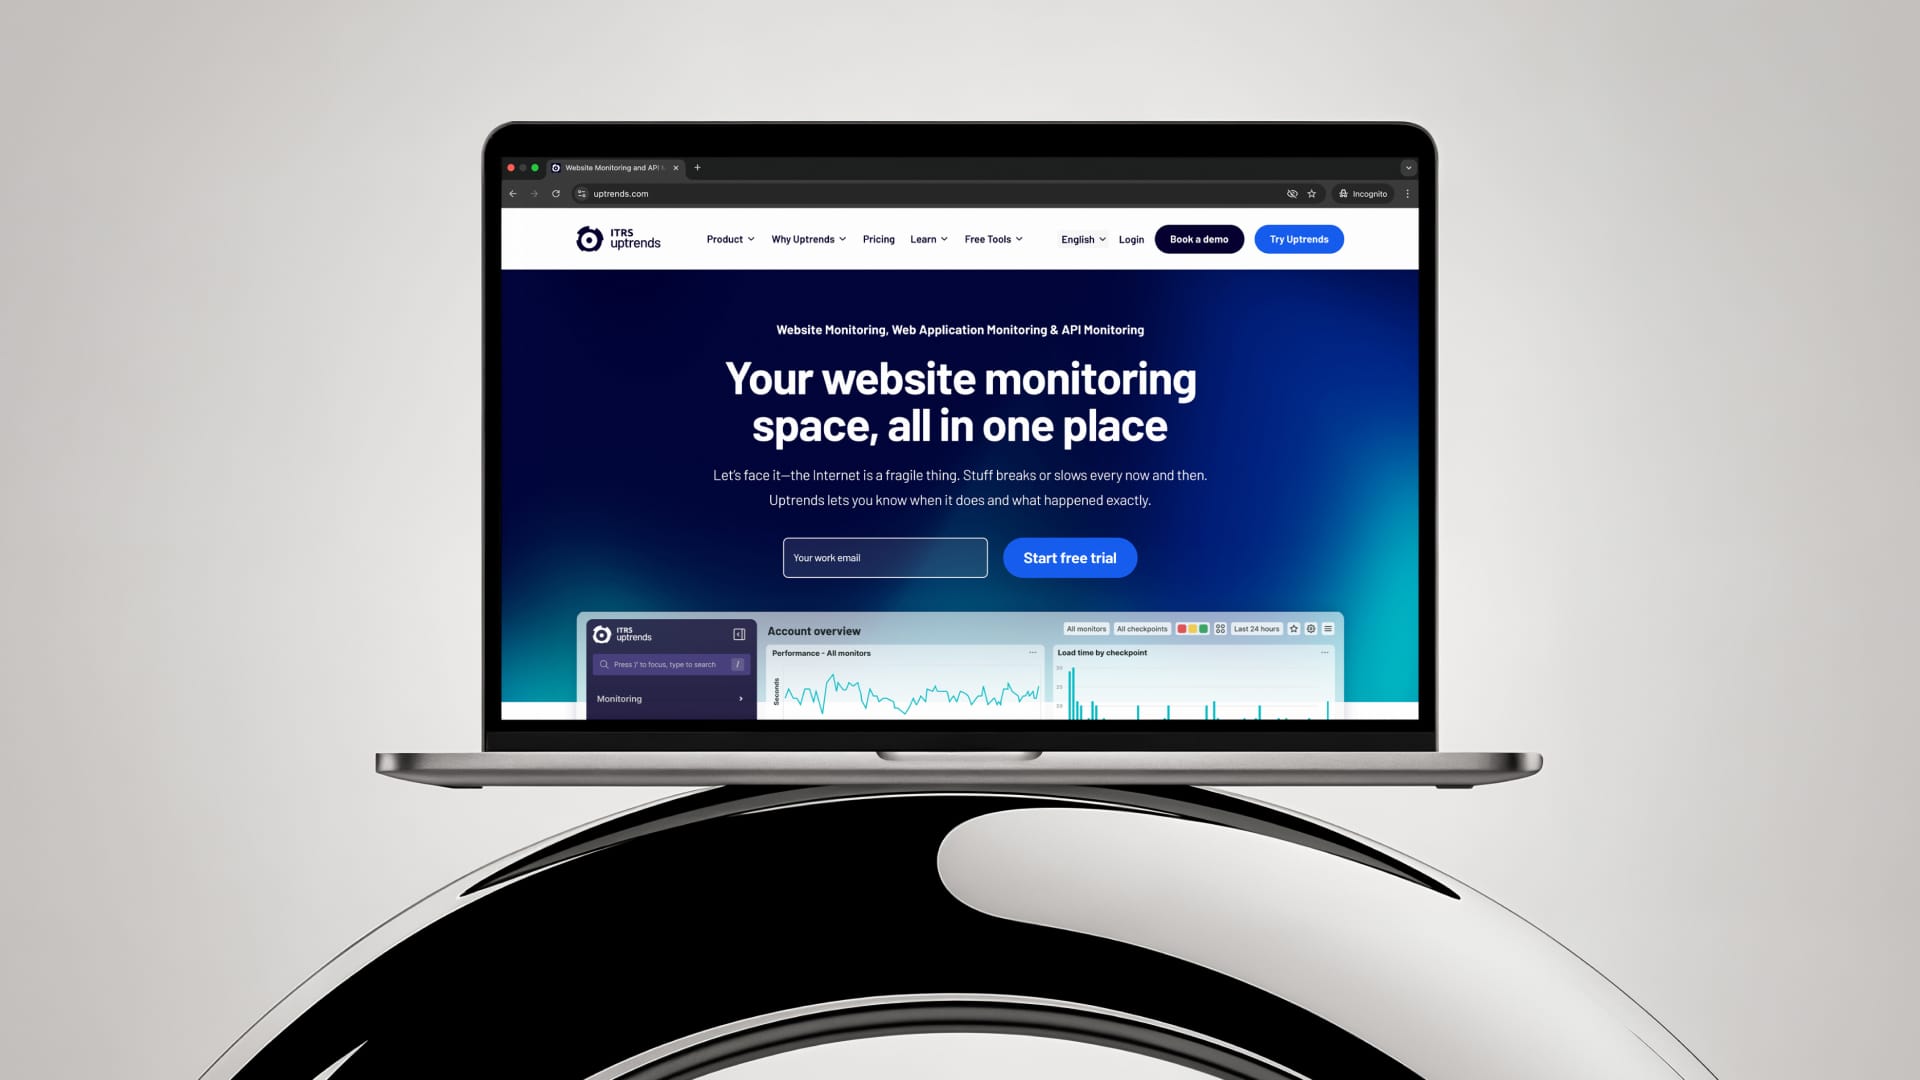
Building a scalable system for ITRS UptrendsDesign System
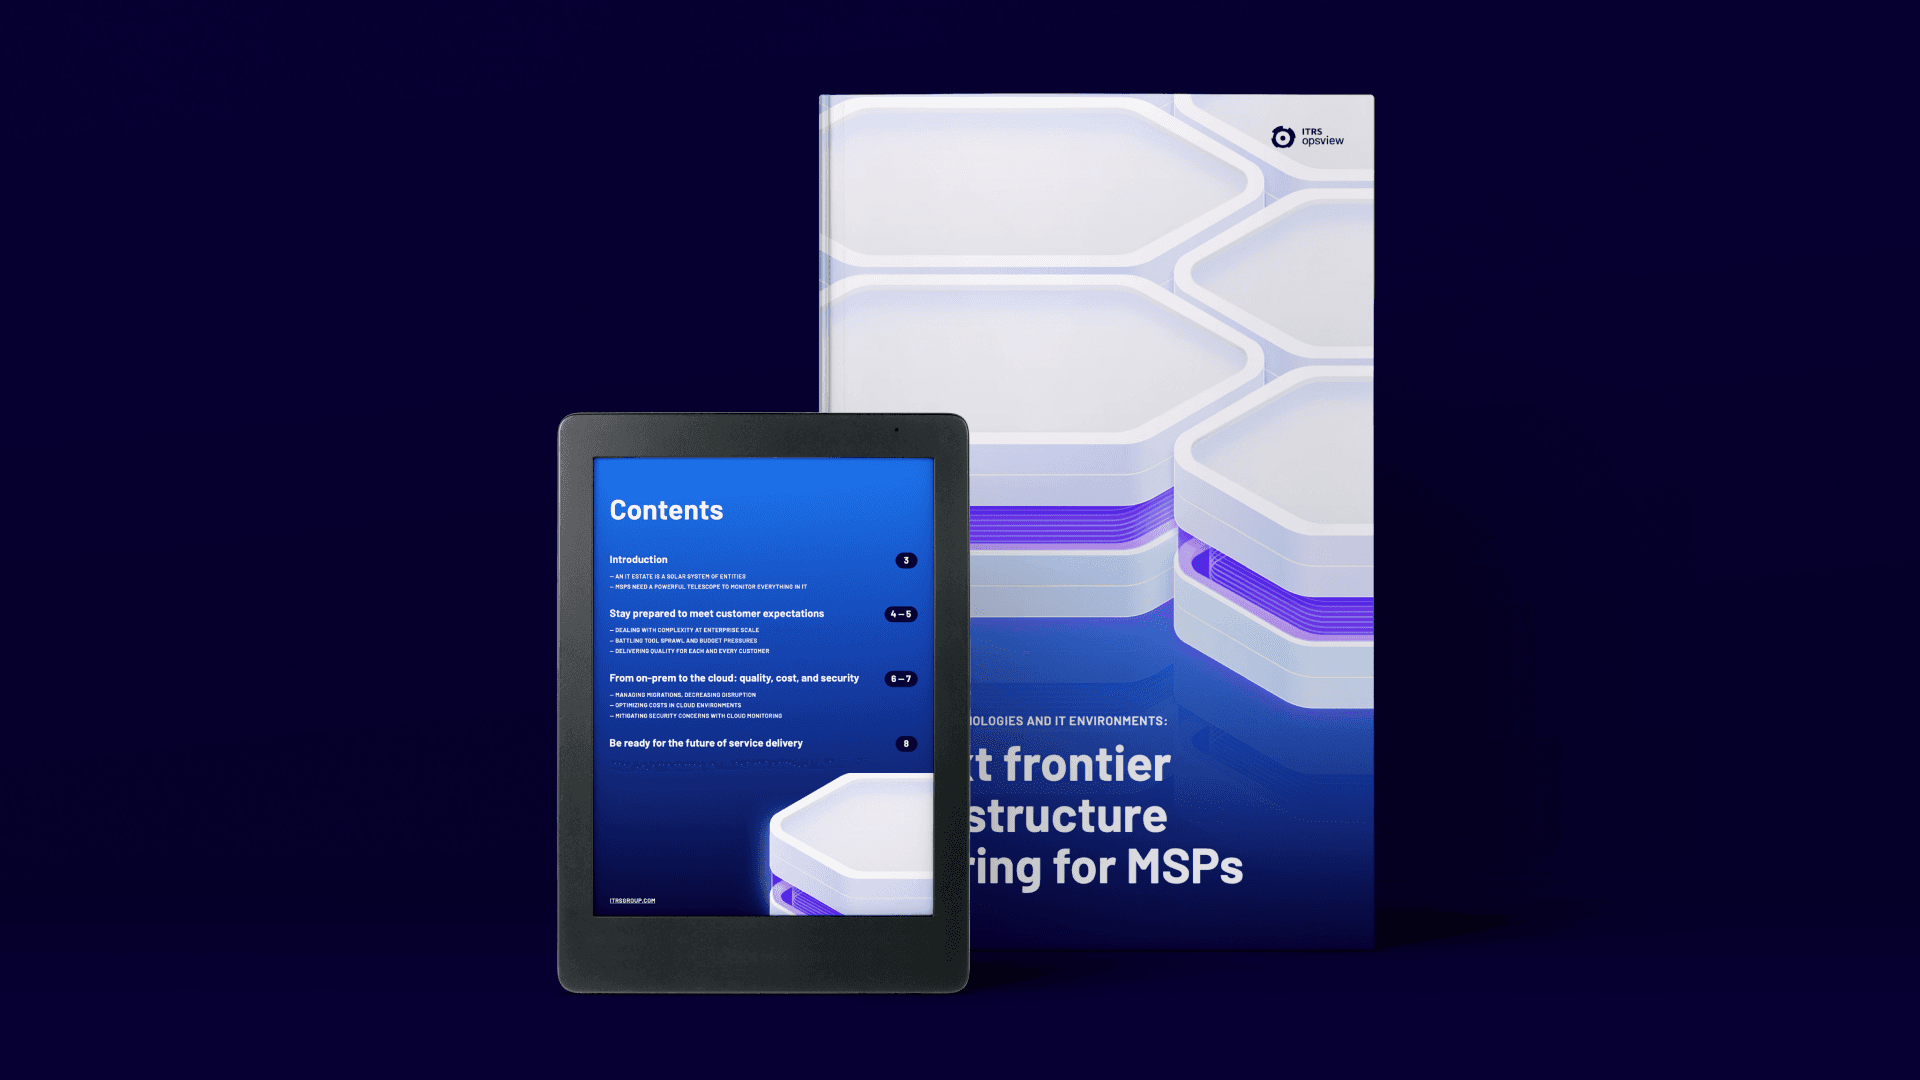
Establishing ITRS Opsview as the go-to for MSPsDigital Campaign & Content

PhotographyLove Stories, People & Places